NewgenONE Platform
Data Visualization
Leverage a visual interface for data exploration, comprehensive reporting, and data cleansing

Leverage different visualization techniques, including bubble charts, scatter plots, and others to present findings from the data in an easy and clean manner. Furthermore, prepare the data for model training by detecting and repairing errors, cleansing data, and performing sanity checks using machine learning-based data quality analysis
Data Visulization Capabilities of NewgenONE Platform
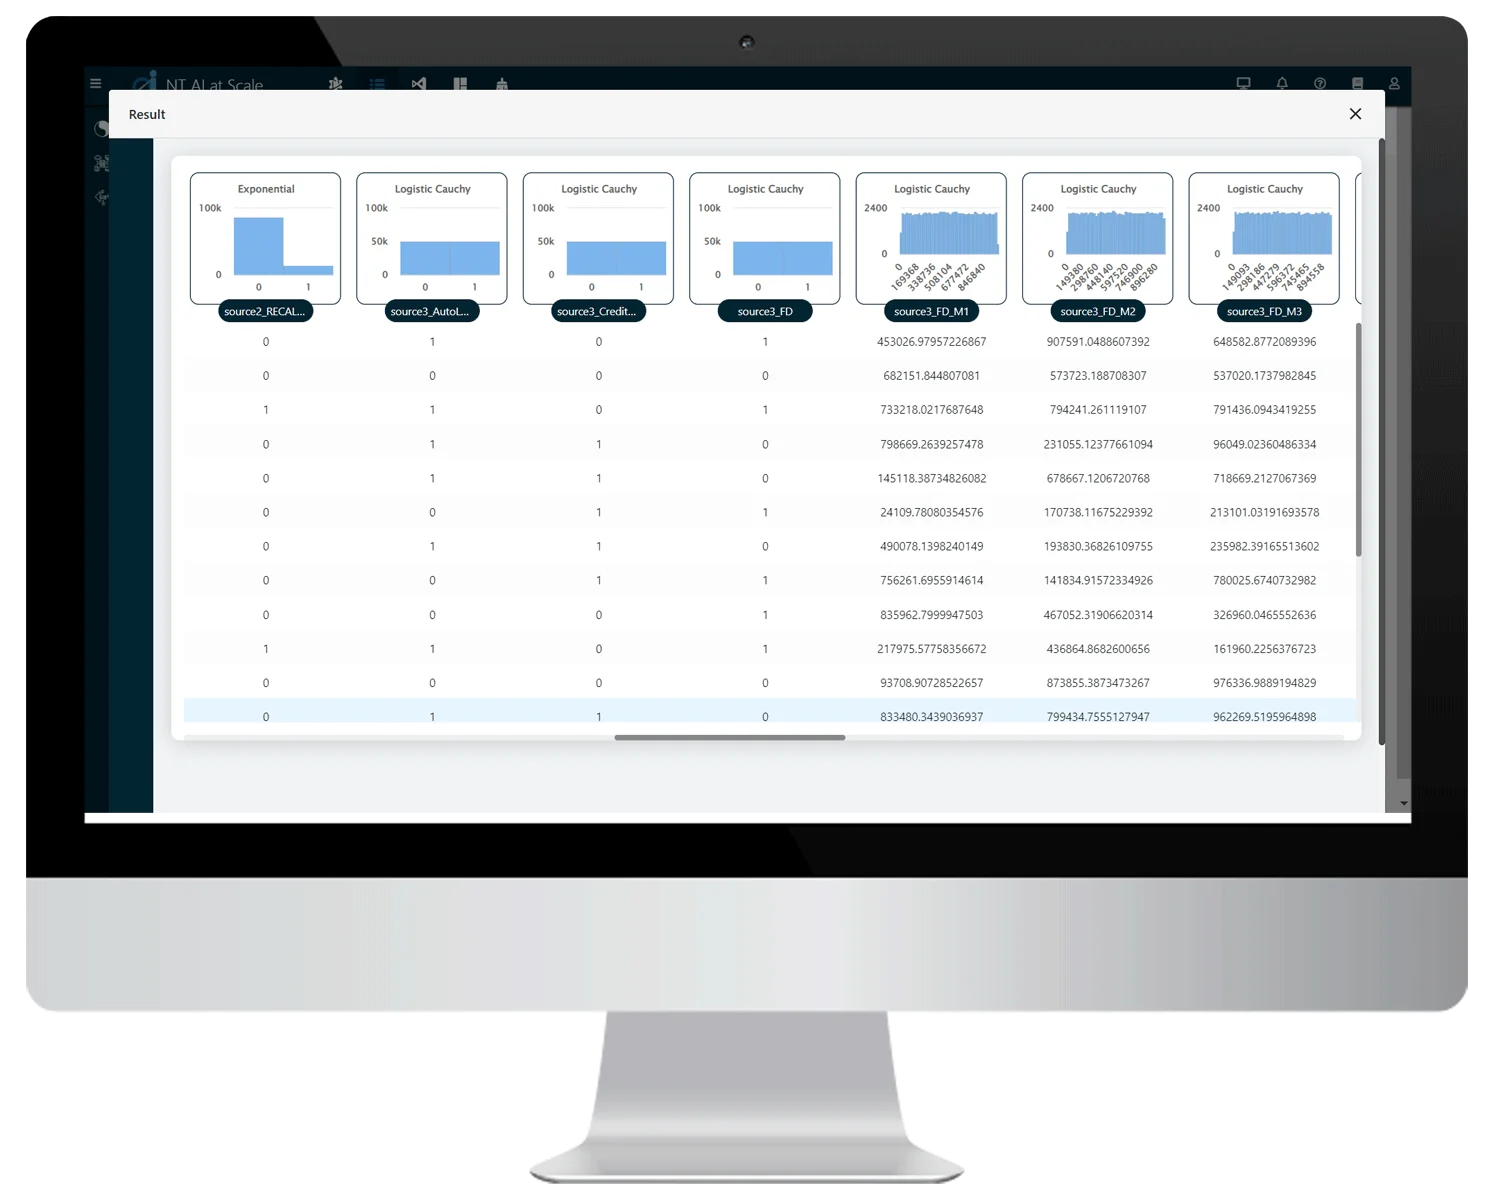
Visualize and Auto Explore Data
Perform automated exploratory analysis on terabytes of data while leveraging the power of distributed computing
Visualize and report data through interactive bubble charts, histograms, scatter plots, and other visualization techniques
Visualize and explore data from different dimensions by creating pivot tables
Cleanse Data and Perform Sanity Checks
Leverage comprehensive data cleaning abilities at complete dataset and column level
Perform machine learning-based data quality analysis operations, including predicting missing values, dropping correlated columns, zero-variance columns, etc.
Perform Statistical Analysis and Generate Reports
Provide approximate distribution inference for each data column
Enable access to several reporting and statistics analysis parameters, including standard deviation, correlation, outliers, etc., for each column
Use the underlying computing capacity with the flexibility to perform exploration on the complete data or on a small sample